
A breakout entry is not something you feel your way into. It is something you build from two measurable components, an anchor and a volatility band, and then test until one combination proves itself. This is the beginner version of that process, using E-mini Nasdaq one-hour data.
Why Breakout Trading Works: It Is All About Momentum
Breakout trading is one of the oldest and most durable techniques in systematic trading, and the reason is simple. It is a bet on momentum. You calculate a level that means something, and when the market crosses it, you are already positioned for the move that follows.
The E-mini Nasdaq on one-hour bars is a good market to learn this on. It is one of the most widely traded index futures in the world, it trends, and it produces the kind of decisive moves a breakout system needs to make money.
On a chart the idea looks like this. There is a green line above price and a red line below it. Cross the green line and you are long into upside momentum. Cross the red line and you are short into a down move. The cross can even happen through a gap, which is fine. The trade is defined by the level, not by how price arrives at it.
The whole game in one sentence
Breakout trading is about breaking one meaningful level. Everything difficult about it comes down to how that level is constructed.
The Real Problem Is Not the Idea, It Is the Level
Beginners rarely struggle with the concept. They struggle with the line. Most of them eyeball a chart, draw something across a few recent highs, and call it resistance. That is guessing with extra steps, and it does not survive contact with live data.
Professional breakout traders are not better at looking at charts. They are working from a level that was calculated rather than drawn, and that they have tested across hundreds of variations before risking anything on it.
The good news for a beginner is that the calculation is not complicated. It has exactly two parts.
Component One: The Point of Initiation
The point of initiation is the anchor. It is the reference the breakout level gets measured from, and on a chart it is usually drawn as a single line that moves with the market.
It can be almost anything objective:
- A moving average. Any period you like. As the period changes, the anchor moves, and so do the long and short bands built off it.
- The lowest low or highest high. A structural anchor taken from a lookback window rather than a smoothed average.
- A pivot point. And pivots can be reset at different times, midnight, 3am, 6am, each producing a genuinely different anchor.
What matters is that the anchor is defined by a rule, so it produces the same line for you as it would for anyone else running the same settings. On its own, though, the point of initiation is not an entry. It is just the place you measure from.
Pivot anchors in particular reward testing. See 300 pivot point strategies tested on NASDAQ for what happens when you run them systematically.
Component Two: The Volatility Band
The second component is space. You need to sit the entry far enough away from the anchor that ordinary noise does not trigger it, and the honest way to measure "far enough" is with volatility rather than a fixed number of points.
That is what Average True Range is for. ATR measures the typical range the market has been covering, so a band built from ATR automatically widens in fast conditions and tightens in quiet ones. A fixed point value cannot do that.
The calculation for each bar is:
- Long entry. Point of initiation plus ATR multiplied by your chosen factor.
- Short entry. Point of initiation minus the same amount.
So an ATR period of 20 with a 1.5 multiplier puts the long band one and a half average ranges above the anchor. That green band is your long trigger, the red band below is your short trigger, and both recalculate on every bar as the anchor and the volatility change.
The formula
Entry level = point of initiation, plus or minus (ATR period x multiplier). Two inputs and one arithmetic step. That is the entire breakout entry.
The Multiplier Is a Trade Frequency Dial
Beginners often hunt for the "correct" multiplier. There is not one. The multiplier is a dial that trades frequency against selectivity, and where you set it changes the character of the strategy completely.
Push it up and the band moves further from the anchor. You get fewer trades, but each one requires a more decisive move to trigger. Pull it down and the band hugs the anchor, and you get far more trades, many of which are noise.
| Multiplier | Band width | Trade frequency | Signal character |
|---|---|---|---|
| Low, around 0.5 | Narrow | Many | More noise, more false starts |
| Medium, around 1.5 | Balanced | Moderate | Common working middle ground |
| High, 3.0 and above | Wide | Few | Rare but more decisive moves |
Watch this live on a chart and it is obvious. Wind the multiplier up far enough and the trades almost disappear. Wind it back down and they flood in. Neither extreme is right by default. The correct setting is whichever one holds up on your market and your timeframe when you test it properly.
You Do Not Guess the Combination, You Test It
Here is where most beginners stall. You now have three things to choose at once: which anchor, which band, and which multiplier. Those choices interact, so testing them one at a time by hand tells you very little, and after a dozen manual attempts you still cannot tell a real edge from a lucky setting.
This is the part BreakoutOS automates. You pick a preset, for example long side, day trading, pivot-point anchors, and the platform expands it into every combination and tests them all. One such preset expands into 600 iterations:
- 8 points of initiation - pivots reset at different hours through the session
- 3 band types - different ways of measuring the space around the anchor
- 25 multipliers - the full frequency range, swept in steps
You can see the full list of what will be tested before it runs, then sort the finished results by in-sample and out-of-sample performance. In the E-mini Nasdaq run, a pivot anchor reset at 6am with an ATR period of 5 and a 1.0 multiplier came out as a strong candidate.
That candidate is what BreakoutOS calls a foundational breakout model. It carries no indicators and no filters, deliberately. The point is to prove the foundation is sound on its own before anything is layered on top, because filters added to a weak model only hide the weakness for a while.
The foundational model is the base layer for everything that follows. See how to build a foundational breakout model for the full walkthrough.
Robustness is what separates a model from a fluke
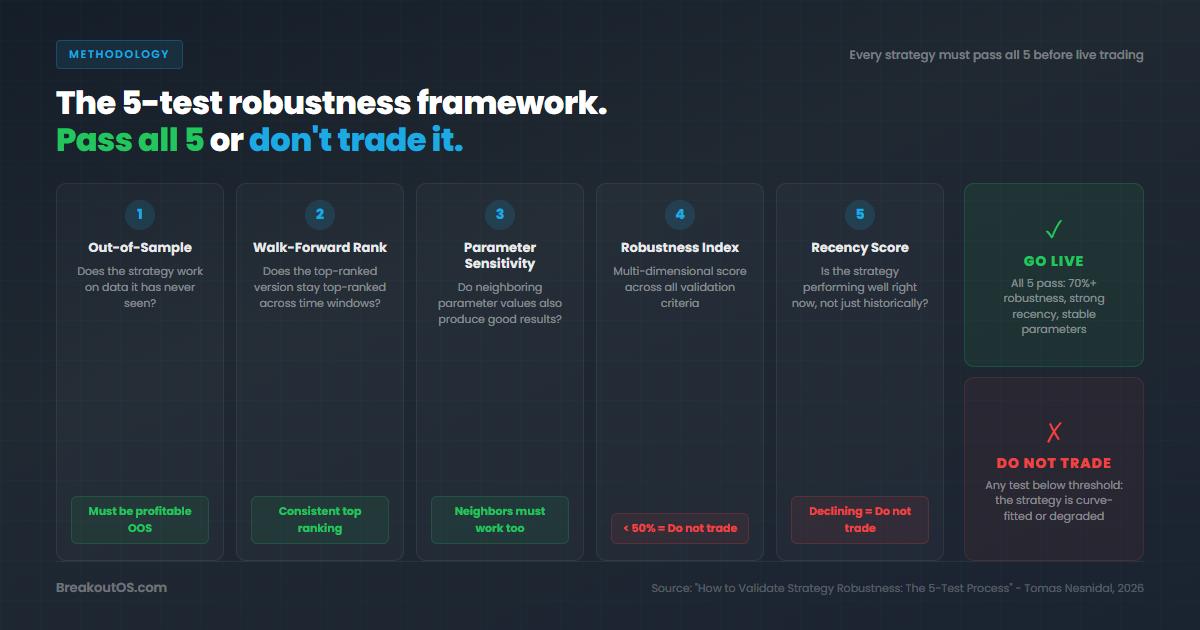
A good-looking result is not the same as a real one. Running the candidate through the robustness suite returned 68% robustness, which sits in acceptable territory and marks the model as viable rather than overfit.
That number matters more than the equity curve. Any set of parameters can be tortured into producing a pretty backtest. Robustness scoring asks whether the result survives when the conditions around it are varied, and that is the question that decides whether a model is worth trading.
From Entry to Exit on the Chart
Put the finished model back on the chart and the whole thing reads cleanly. The blue line is the point of initiation. The band sits a calculated distance from it. The trade opens the moment price crosses that band, and the exit in this example is a simple end-of-day close at 11pm.
The exit is worth a note. Nothing here demands an end-of-day exit. It happens to be what this day-trading preset used, and it is one of the settings you can vary and retest like any other. A breakout entry and a breakout exit are separate problems.
Because the model is defined mathematically rather than visually, it converts straight into platform code. BreakoutOS outputs native EasyLanguage for TradeStation and MultiCharts, plus AI-convertible pseudocode for NinjaTrader, MetaTrader, AmiBroker, TradingView and Python.
- The anchor gives you the reference. A moving average, a high or low, or a pivot at a chosen reset time.
- The ATR band gives you the space. Volatility-scaled, so it adapts instead of breaking in fast markets.
- The multiplier sets selectivity. Fewer decisive trades, or more frequent noisier ones.
- Robustness testing decides if it is real. Without it you have a backtest, not a strategy.
None of this requires intuition, and none of it requires you to be right about where the market is going. It requires a rule for the anchor, a rule for the space, and enough testing that the winner is not an accident.
See BreakoutOS in Action
Watch a breakout entry get built and tested across hundreds of combinations, start to finish.
Watch Demo Videos →Frequently Asked Questions

About the Author
Tomas Nesnidal, known to the systematic trading community as Mr. Breakouts, is a breakout trading specialist, hedge fund co-founder, and creator of BreakoutOS. He has managed institutional portfolios using breakout strategies for over 15 years, trading from 65+ countries. He is the author of The Breakout Trading Revolution and co-founder of Breakout Trading Academy.