A 10-hour NASDAQ breakout strategy uses a time-limited entry window during the main US session (9 AM - 3 PM ET), calculates breakout levels from the previous close using ATR, and exits after 10 bars on the 60-minute chart. BreakoutOS handles the entire workflow - from session analysis to parameter calibration - without writing a single line of code.
Why Time-Window Strategies Work on NASDAQ
NASDAQ is one of the most liquid index futures contracts in the world. But that liquidity is not evenly distributed across the 23 hours it trades each day. The bulk of meaningful volume concentrates in the main US session between 9:00 AM and 3:00 PM Eastern.
This matters because breakout strategies need volume behind them. A breakout during the overnight session might technically trigger, but without real participation behind the move, it fizzles out. Building a strategy that only operates during peak hours filters out this noise automatically.
In BreakoutOS, this is handled through the Market Mapper tool. You load 60-minute E-mini NASDAQ data, pull up the volume profile, and the session boundaries become immediately visible. The spike at 9 AM, the sustained activity through midday, the drop-off after 3 PM. You are not guessing where to trade. The data shows you.
The Mr. Breakouts Formula Applied to NASDAQ
Every strategy in BreakoutOS follows the same core framework:
Point of Initiation + (Space Multiplier x ATR) = Breakout Level
For this NASDAQ strategy, the specific settings are:
- Point of Initiation: Yesterday's close at 3:00 PM ET
- ATR Period: 14 (standard, robust setting)
- Space Multiplier: 3x ATR
- Direction: Long only
- Entry Window: 9:00 AM - 3:00 PM ET
- Exit: After 10 bars (10 hours on the 60-minute chart)
The logic is straightforward. Each morning, BreakoutOS calculates how far price needs to travel above yesterday's close (scaled by recent volatility) before triggering a long entry. If price reaches that level during the session, you are in. If not, no trade that day.
How the 10-Hour Holding Period Was Found
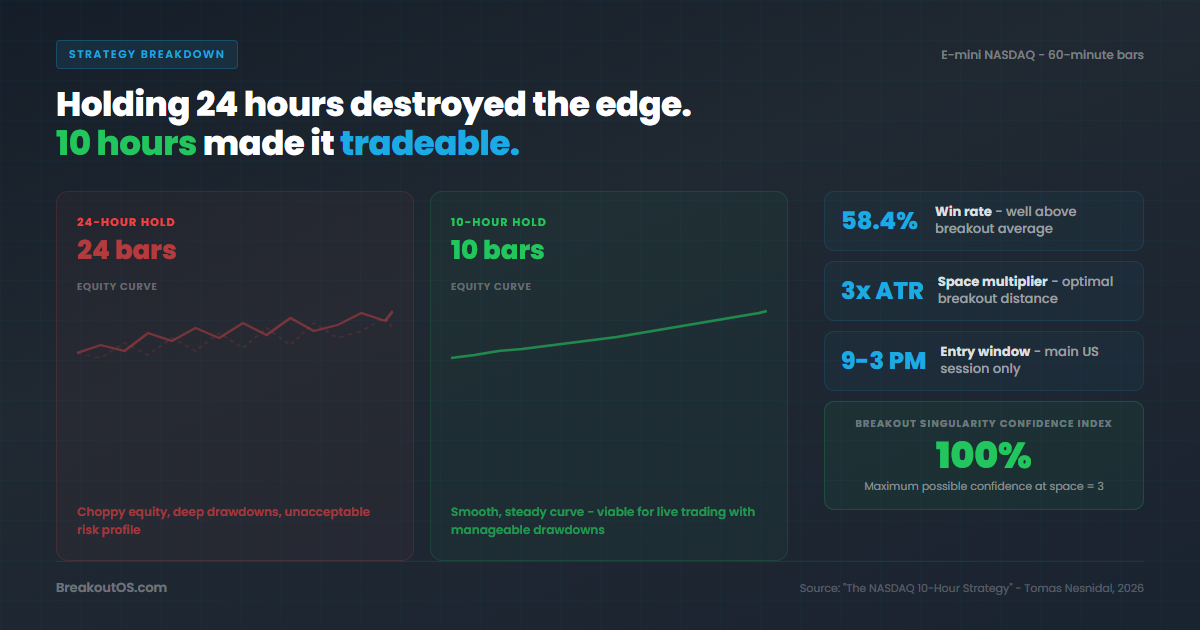
The first version of this strategy used a 24-hour hold (23 bars, accounting for the one-hour gap between sessions). It showed a directional bias but nothing worth trading. The equity curve was rough and the drawdowns were too deep.
Cutting the holding period to 10 hours changed everything. The equity curve smoothed out significantly, drawdowns shrank, and the overall risk profile became viable. This is a pattern I see repeatedly across index markets - shorter holding periods often outperform longer ones because you avoid overnight risk and mean-reversion forces that work against breakout entries.
In BreakoutOS, testing different exit timings takes seconds. You change one parameter in the Backtester, hit run, and see the results immediately. No coding, no debugging, no waiting for compilation.
Calibrating the Space Multiplier
Finding a parameter that "looks good" in a backtest is the easy part. Knowing whether that parameter is statistically robust or just a lucky number is where most traders get stuck.
The initial space multiplier of 2 produced too many trades with a low average profit per trade. Increasing to 3 reduced the trade count but dramatically improved equity smoothness and recent performance.
But is 3 the right number, or is it overfit?
BreakoutOS answers this with the Breakout Space Calibrator. This tool tests the strategy across a range of multiplier values and evaluates each one on multiple dimensions simultaneously:
- Breakout Singularity Confidence Index: 100% for space = 3 (maximum possible)
- Net Profit Calibration: Highest ranked among all tested multipliers
- Net Profit/Drawdown Calibration: Highest ranked
- Win Percentage: 58.4% (second highest) - well above average for breakout strategies
A 100% confidence index means the multiplier of 3 is not just marginally better. It dominates across every calibration dimension.
Stress Testing with Reduced Data
To confirm this was not a fluke, the calibration was re-run with only 75% of the historical data in-sample. Space 3 remained among the highest-ranked values with 100% confidence intact.
The recency test (isolating only the last 3-4 years) showed the same result. Space 3 consistently appeared at the top across all metrics in recent market conditions - which matters more than decade-old data for a strategy you plan to trade today.
Day-of-Week Analysis
BreakoutOS also breaks down performance by day of the week. For this NASDAQ strategy:
- Monday through Thursday: Strong, consistent performance
- Friday: Removing it actually worsened overall results
So all five trading days stay in. The edge is distributed evenly enough that excluding any day hurts more than it helps.
What Makes This a BreakoutOS Workflow
You could theoretically build this strategy manually with a coding platform. But the BreakoutOS workflow compresses what would take days into minutes:
- Market Mapper identifies the optimal session window through volume analysis
- Backtester prototypes the strategy with different holding periods and parameters
- Breakout Space Calibrator validates whether the space multiplier is robust or overfit
- Confidence Index gives a single number that tells you if the parameter is safe to fix
The entire build - from loading data to having a calibrated base strategy - took under five minutes. No code written. No indicators stacked. Just one formula, applied to the right session, with one calibrated parameter.
This is a base strategy. It still needs filters, forward testing, and full robustness validation before live capital. But as a foundation, every decision is backed by data rather than intuition.
See BreakoutOS in Action
Watch a full strategy build from blank slate to validated model.
Watch Demo Videos →Frequently Asked Questions

About the Author
Tomas Nesnidal, known to the systematic trading community as Mr. Breakouts, is a breakout trading specialist, hedge fund co-founder, and creator of BreakoutOS. He has managed institutional portfolios using breakout strategies for over 15 years, trading from 65+ countries. He is the author of The Breakout Trading Revolution and co-founder of Breakout Trading Academy.