The best filter for breakout trading on index markets is bar range relative to ATR - a simple volatility measure that reduced max drawdown by 40% and improved net profit by 60% across 3,500 tested strategies. BreakoutOS's Filters Tester systematically ranks every filter by a proprietary Uplift Index, separating real edge from curve-fitted noise.
The Problem with Picking Indicators Manually
Most traders pick indicators based on popularity, YouTube recommendations, or what "feels right" on a chart. They test one indicator on one strategy, see an improvement, and declare it works. That approach tells you almost nothing.
A filter that helps one specific strategy might be perfectly curve-fitted to that setup. To really know whether a filter has value, you need to see consistent improvement across a large sample of strategies - the same principle that separates a verified edge from random chance.
This is exactly what the BreakoutOS Filters Tester was built for. It does not ask "does this filter make one strategy look better?" It asks "does this filter consistently improve strategies across hundreds of variations?"
How 100 Indicators Were Tested Across 3,500 Strategies
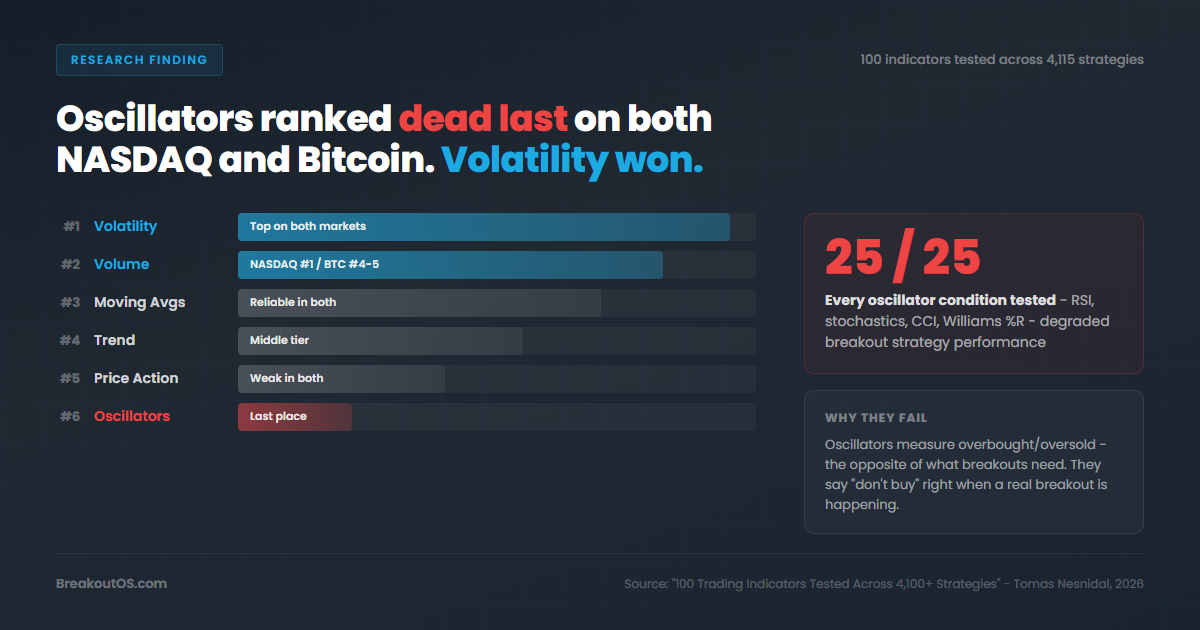
I used Gemini AI to generate 100 different filter conditions written in EasyLanguage. After cleanup (removing duplicates and non-functional code), the 100 conditions fell into six categories:
| Category | Number of Conditions |
|---|---|
| Moving Averages | 15 |
| Oscillators | 25 |
| Price Action | 15 |
| Trend | 15 |
| Volatility | 15 |
| Volume | 15 |
Each condition was tested as a filter on top of thousands of breakout strategies built with the Mr. Breakouts Formula on NASDAQ 60-minute data. That produced 3,500 strategy-filter combinations imported into BreakoutOS for analysis.
The key metric is the Uplift Index - a proprietary BreakoutOS measure that evaluates how much a filter improves a strategy across multiple dimensions simultaneously: net profit, return ratio, win percentage, and average trade size. It is not just measuring one thing. It measures whether the filter makes the whole strategy better.
Cluster Analysis: Which Categories Actually Work?
Before drilling into individual indicators, the Filters Tester groups results by category. This gives a cleaner signal than comparing 100 individual filters, which gets noisy.
| Filter Category | In-Sample | Out-of-Sample |
|---|---|---|
| Volume | Positive uplift | Positive uplift |
| Moving Averages | Positive uplift | Positive uplift |
| Oscillators (25 conditions) | Negative - made results worse | Mixed |
| Price Action | Negative - made results worse | Mixed |
| Trend | Negative - made results worse | Mixed |
| Volatility | Negative - made results worse | Mixed |
Only two categories showed consistent positive uplift both in-sample and out-of-sample: volume and moving averages. Everything else - including oscillators, which had the most conditions at 25 - actively degraded strategy performance in-sample.
If you are using RSI, stochastics, or other oscillator-based filters on your index breakout strategies, this data should make you reconsider.
The Winning Filter: Bar Range / ATR
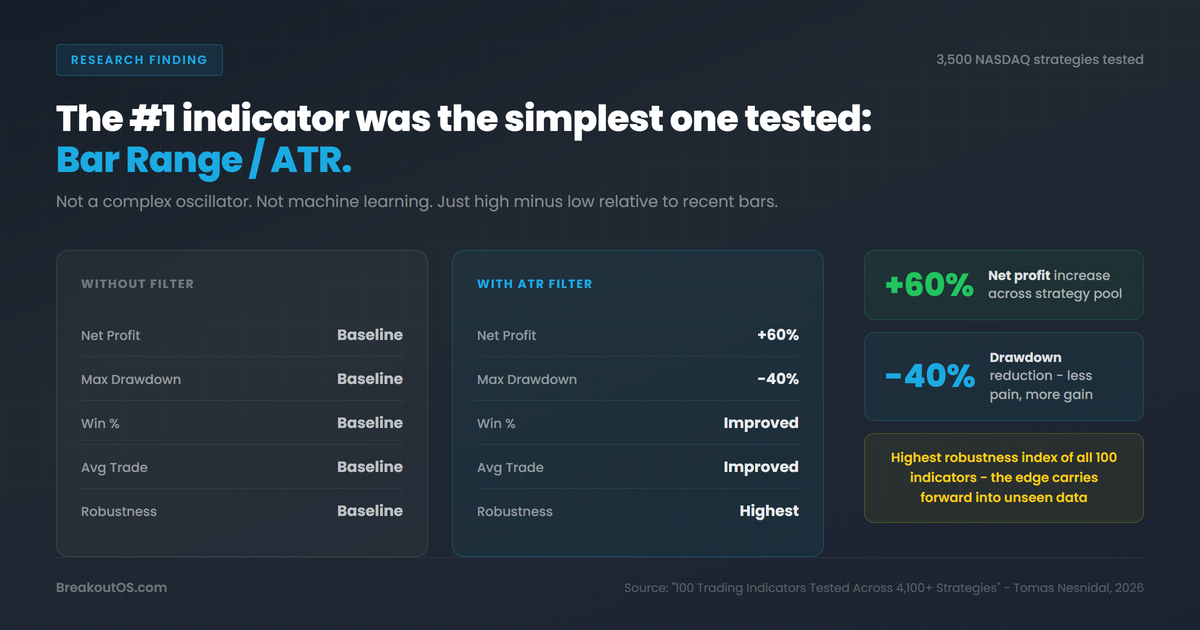
When drilling from categories to individual conditions, one clear winner emerged. It was not a fancy AI-generated oscillator. It was not a machine learning signal. It was bar range relative to ATR - essentially, high minus low compared to recent average true range.
This indicator has been around for decades. It measures something fundamental about market behavior: how much a bar has expanded or contracted relative to its recent history.
Performance Impact Across 3,500 Strategies
- Max drawdown decreased by 40% - the single most important risk metric
- Net profit improved by 60%
- Win percentage improved - more winning trades, fewer losers
- Average trade improved - each trade captured more profit on average
- Highest robustness index of any filter tested
That last point is critical. The robustness index measures whether the improvement you see in-sample actually carries forward to out-of-sample data. A filter with high in-sample performance but low robustness is curve-fitted. Bar range/ATR had the highest robustness of all 100 conditions tested. The edge is real and it persists on unseen data.
Why Simple Filters Beat Complex Ones
There is a pattern here that matters for anyone using BreakoutOS (or any systematic approach):
Complex indicators overfit by design. An oscillator with five parameters can be tuned to match historical data perfectly. That precision is exactly the opposite of what you want. A filter that perfectly matches the past almost certainly breaks in the future.
Markets are driven by simple forces. Supply and demand, fear and greed, expansion and contraction. You do not need a neural network to measure whether recent bars are big or small relative to their history. High minus low does the job.
Regime sensitivity kills complexity. The AI-generated oscillator conditions were highly tuned to specific market regimes. When the regime changed, they collapsed. Bar range and ATR measure a fundamental property - volatility expansion - that persists across all market regimes.
How to Use This in the BreakoutOS Workflow
The Filters Tester in BreakoutOS automates this entire analysis. Here is the practical workflow:
- Build base strategies using the Mr. Breakouts Formula in the Backtester
- Import filter conditions - BreakoutOS accepts TradeStation EasyLanguage conditions
- Run the Filters Tester which calculates the Uplift Index for every filter across all strategies
- Review cluster analysis to see which categories of filters show positive uplift
- Drill into top performers to identify the specific conditions worth adding
- Check the robustness index to confirm the improvement carries forward out-of-sample
The entire process that would take weeks of manual testing happens in a single analysis run. And the output is not subjective - the Uplift Index gives you a concrete ranking backed by thousands of strategy variations.
What This Means for Your Strategy Development
Based on 3,500 strategies and 100 filter conditions on NASDAQ:
- Add a bar range or ATR-based filter first. It is the single highest-impact addition you can make to an index breakout strategy.
- Test across many strategies, not just one. If a filter only helps one specific setup, it is probably curve-fitted.
- Stop stacking oscillators. The data is clear - oscillator-based filters actively degraded breakout strategy performance on indexes.
- Prioritize robustness over peak performance. A small, consistent improvement that carries forward is worth far more than spectacular in-sample results that collapse out-of-sample.
Related Research
100 Trading Indicators Tested Across 4,100+ Strategies: What Actually Works - The full quantitative study behind this article's filter rankings, covering both NASDAQ and Bitcoin across 4,100+ strategies.
5 Proven Techniques to Filter False Breakouts (Data From 2,500+ Strategies) - Five zero-parameter filtering techniques tested across four index futures markets.
See BreakoutOS in Action
Watch a full strategy build from blank slate to validated model.
Watch Demo Videos →Frequently Asked Questions

About the Author
Tomas Nesnidal, known to the systematic trading community as Mr. Breakouts, is a breakout trading specialist, hedge fund co-founder, and creator of BreakoutOS. He has managed institutional portfolios using breakout strategies for over 15 years, trading from 65+ countries. He is the author of The Breakout Trading Revolution and co-founder of Breakout Trading Academy.