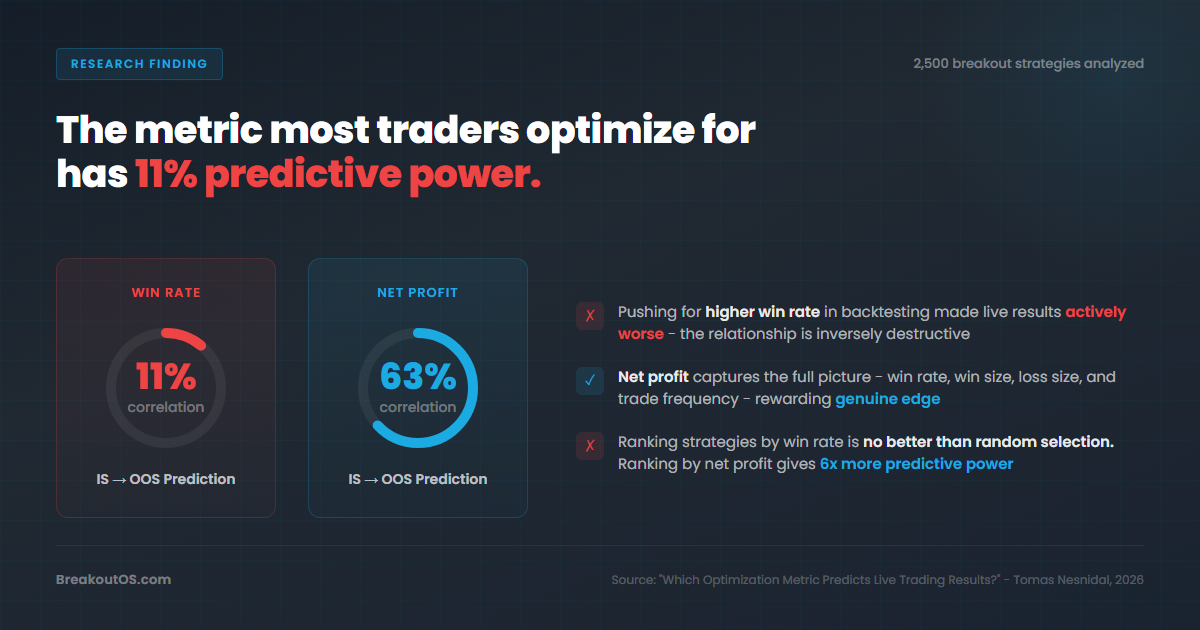
Most traders optimize their strategies for win percentage. A correlation analysis of 2,500 breakout strategies reveals this is one of the most destructive habits in algorithmic trading. Win percentage shows only 11% correlation between in-sample and out-of-sample results - statistically indistinguishable from random. Net profit, by contrast, shows 63% correlation. This study presents the full methodology, metric-by-metric findings, and practical ranking framework for selecting strategies that actually survive live trading.
The Problem: Optimizing for the Wrong Metric
Every trading strategy needs a fitness function - the metric the optimization engine maximizes when testing parameter combinations. This choice determines what kind of strategy you end up with and whether it has any chance of working in live markets.
Most traders, especially those early in their development, default to win percentage. The logic feels sound: a strategy that wins 75% of the time must be better than one that wins 50%. Every losing trade hurts, so the natural response is to add filters and tighten parameters until the backtest shows 70%, 75%, 80% winners.
This instinct is wrong. Not just unhelpful - actively destructive.
The question is not which metric looks best in backtesting. The question is which metric, when optimized in-sample, actually predicts out-of-sample performance. These are very different questions, and confusing them is where most traders go wrong.
Study Design and Methodology
To answer this with data rather than theory, I ran a correlation analysis across 2,500 breakout strategies. Here is the setup:
Sample size: 2,500 strategies built using the Missed Breakouts model across multiple markets and timeframes.
Data split: Each strategy had separate in-sample data (the historical data used for building and optimization) and out-of-sample data (completely unseen data used purely for validation). Think of in-sample as studying for an exam. Out-of-sample is the actual exam.
Metrics recorded for each strategy:
- In-sample and out-of-sample win percentage
- In-sample and out-of-sample net profit
- Profit factor (gross profit divided by gross loss)
- Net profit to maximum drawdown ratio
- Sharpe ratio
Analysis method: For each metric, I calculated the Pearson correlation coefficient between in-sample values and out-of-sample values across all 2,500 strategies. A correlation of 1.0 means perfect predictive power - high in-sample always means high out-of-sample. A correlation of 0.0 means no predictive power at all - in-sample tells you nothing about out-of-sample.
I also plotted regression lines and scatter plots for each metric, and used a slider-based simulation to test what happens when traders push each metric progressively higher during optimization. The specific market, timeframe, and in-sample/out-of-sample split ratio do not meaningfully change the conclusions. These are nuances. The core patterns hold regardless.
Metric-by-Metric Findings
Win Percentage: 0.11 Correlation (11%)
The correlation between in-sample win percentage and out-of-sample win percentage was 0.11. Eleven percent. That is essentially zero dependency.
When I plotted the regression line, it was almost perfectly flat. A strategy that won 80% of its trades in-sample was no more likely to maintain that win rate out-of-sample than a strategy that won 50%. The scatter plot looked like random noise - no meaningful relationship whatsoever between backtest win rate and live win rate.
All those hours spent adding filters and tweaking parameters to push a win rate from 60% to 75%? The data says those improvements carry virtually no predictive value for how the strategy will perform on unseen data.
Net Profit: 0.63 Correlation (63%)
When I switched the analysis to net profit, the picture changed completely. The correlation between in-sample net profit and out-of-sample net profit was 0.63. That is one of the highest correlations you will ever see in trading data.
The regression line sloped clearly upward - from the lower-left corner toward the upper-right. Strategies with higher in-sample net profit also tended to produce higher out-of-sample net profit. The relationship was strong, consistent, and statistically meaningful.
Profit Factor, Sharpe Ratio, and Other Metrics
Profit factor (gross profit divided by gross loss) and net profit to drawdown ratio fall between the two extremes. They carry more predictive information than win percentage but less than raw net profit. Sharpe ratio behaves similarly - useful but not as strongly correlated as net profit across this sample of breakout strategies.
The key insight is not that only one metric works. It is that single-dimensional metrics like win percentage, which measure only one aspect of performance, consistently underperform holistic metrics that capture the full picture of a strategy's edge.
Why Win Percentage Fails: The Overfitting Mechanism
The 11% correlation is bad enough on its own. But the real danger is what happens when traders actively push for higher win rates - which is exactly what inexperienced traders do.
Using a slider tool that simulates pushing the minimum win percentage threshold progressively higher, I tracked how the mean out-of-sample win percentage responded. Here is what the data showed:
As the in-sample win percentage threshold increased, the average out-of-sample win percentage decreased.
Read that again. The harder you optimize for win rate in backtesting, the worse your live results become on average. The relationship is inversely destructive.
The mechanism is straightforward:
- A trader builds a strategy showing 60% win rate in-sample.
- They decide 60% is not good enough. They add five more filters and re-optimize all input parameters.
- The in-sample win rate climbs to 80%. The equity curve looks beautiful.
- They launch it live. The strategy immediately starts losing money.
What happened? Each filter and parameter adjustment made the strategy more specific to the historical data it was built on. The strategy did not find a better edge - it memorized noise. Every quirk in the historical data that happened to produce a losing trade got filtered out. But those quirks were random. They will not repeat in the same way. The strategy became brittle, hyper-specific, and ultimately worthless on new data.
This is why win percentage overfitting destroys accounts. It is not that win percentage is merely useless as a selection metric. It is that actively optimizing for it makes your strategies worse.
Why Net Profit Works: A Holistic Measure of Edge
Net profit captures the overall quality of a strategy's edge in a way that win percentage cannot. It accounts for:
- Win rate - how often the strategy wins
- Average win size - how much it makes when it wins
- Average loss size - how much it loses when it is wrong
- Trade frequency - how many opportunities it captures
- The interaction between all four - the full picture
A strategy can have a modest 45% win rate but generate strong net profit because its winners are substantially larger than its losers. That kind of asymmetry - winning less often but winning bigger - tends to persist across different data sets because it reflects genuine market behavior rather than statistical artifacts.
Breakout strategies naturally produce this profile. Most breakout attempts fail, producing many small losses. But when a real breakout runs, it produces an outsized gain that more than compensates. This is a real edge rooted in how markets actually move - not a backtest illusion created by stacking filters.
When I used the slider to push for progressively higher in-sample net profit, the thermometer kept moving right. Unlike win percentage, higher in-sample net profit led to higher out-of-sample net profit on average. At some point the improvement stalls - you cannot push forever without overfitting even with net profit - but the directional relationship holds. Higher in-sample net profit predicts higher out-of-sample net profit.
Download This Article as a PDF
Get the complete article in a clean, printable format.
Free download. We'll send the PDF to your inbox. You'll also receive future updates. Unsubscribe anytime.
Check your email
Your PDF is on its way. Check your inbox (and spam folder, just in case).
Full Correlation Ranking Table
| Rank | Fitness Function | IS to OOS Correlation | Predictive Value | Overfitting Risk When Pushed |
|---|---|---|---|---|
| 1 | Net Profit | 0.63 (63%) | Strong - clear upward regression line | Moderate - rewards genuine edge capture |
| 2 | Net Profit to Drawdown Ratio | Moderate-High | Good - accounts for risk-adjusted returns | Moderate |
| 3 | Profit Factor | Moderate | Useful - captures win/loss asymmetry | Moderate |
| 4 | Sharpe Ratio | Moderate | Useful - risk-adjusted but sensitive to assumptions | Moderate-High |
| 5 | Win Percentage | 0.11 (11%) | Essentially none - flat regression line | Very High - inversely destructive when pushed |
Note: Net profit and win percentage were the two metrics tested with full correlation coefficients across the 2,500-strategy sample. The intermediate metrics (profit factor, Sharpe ratio, net profit to drawdown ratio) rank between the two based on their structural properties - they capture more dimensions of strategy quality than win percentage but are not as holistic as raw net profit.
Practical Implications for Strategy Selection
Say you have built 500 breakout strategies and need to narrow them down to the best 10 for live trading. Based on this data:
If you rank by win percentage: You are essentially picking at random. The 11% correlation means your selection has almost no statistical basis. You might as well draw names from a hat.
If you rank by net profit: The 63% correlation means strategies at the top genuinely have better odds of performing well out-of-sample. You are working with the data in your favor.
This does not mean you can ignore overfitting entirely when optimizing for net profit. You absolutely still need proper robustness testing - walk-forward analysis, cross-market validation, parameter stability checks. But net profit gives you a dramatically better starting point. It is a selection metric that actually carries meaningful information about future performance.
A practical workflow:
- Generate a large pool of strategies (hundreds or thousands)
- Rank by in-sample net profit as your primary fitness function
- Apply secondary filters - maximum drawdown limits, minimum trade count, profit factor thresholds
- Validate top candidates with out-of-sample testing
- Never select strategies based on win percentage alone
Key Findings Summary
- Win percentage has only 11% correlation between in-sample and out-of-sample results. This is statistically negligible. Backtest win rate tells you almost nothing about live performance.
- Net profit has 63% correlation between in-sample and out-of-sample results. This is one of the strongest correlations observed in trading data and makes net profit a reliable primary fitness function.
- Pushing for higher win percentage actively degrades live performance. The relationship is inversely destructive - the harder you optimize for win rate, the worse your out-of-sample results become on average.
- Pushing for higher net profit improves live performance. Unlike win percentage, higher in-sample net profit leads to higher out-of-sample net profit on average.
- Win percentage fails because it is single-dimensional. It measures only one aspect of performance and can easily be inflated by adding filters that overfit to historical noise.
- Net profit succeeds because it is holistic. It captures win rate, win size, loss size, and trade frequency simultaneously, rewarding strategies with genuine market edges.
- The overfitting mechanism is filter accumulation. Each filter added to boost win percentage makes the strategy more specific to historical data and less likely to generalize to unseen data.
- Strategy selection should prioritize net profit over win rate. When narrowing a pool of strategies for live trading, ranking by net profit gives statistically sound results. Ranking by win percentage is no better than random selection.
See BreakoutOS in Action
Watch a full strategy build from blank slate to validated model.
Watch Demo Videos →Frequently Asked Questions

About the Author
Tomas Nesnidal, known to the systematic trading community as Mr. Breakouts, is a breakout trading specialist, hedge fund co-founder, and creator of BreakoutOS. He has managed institutional portfolios using breakout strategies for over 15 years, trading from 65+ countries. He is the author of The Breakout Trading Revolution and co-founder of Breakout Trading Academy.
Download This Article as a PDF
Get the complete article in a clean, printable format.
Free download. We'll send the PDF to your inbox. You'll also receive future updates. Unsubscribe anytime.
Check your email
Your PDF is on its way. Check your inbox (and spam folder, just in case).