Last updated: June 21, 2026
I Tested 300 NASDAQ Time Strategies (And Found the 1% Outlier)
Most traders obsess over indicators, patterns, and entry signals. They almost never ask a simpler question: does the clock itself have an edge? In this study I mapped 276 time strategy combinations across roughly 20 years of E-mini NASDAQ data with a single click, then filtered down to the windows that actually hold up. One pairing stood out from the rest. Here is exactly how I found it, and how you can map any market the same way.
What Is a Time Strategy?
A time strategy is one of the simplest concepts in systematic trading and one of the most overlooked. Instead of entering on an indicator or a price pattern, you enter and exit based purely on the clock. You find the specific hours, and sometimes the specific days of the week, where a market has a consistent tendency to move in one direction.
The idea is that markets are not uniform across the week. The E-mini NASDAQ does not behave the same way at 3am as it does at 10am, and it does not behave the same way on a Monday as it does on a Thursday. Some sessions carry a structural long bias, others lean short, and many are just noise. A time strategy isolates the sessions that carry the bias.
You can trade these tendencies as standalone strategies, and in this study I show that you can. But the bigger value is using them as a foundation. Once you know that Monday between 6am and 8pm has a strong long bias, you can build your own breakout entries inside that window and stack a real edge on top of an already favourable backdrop.
How I Mapped 276 NASDAQ Time Combinations in One Click
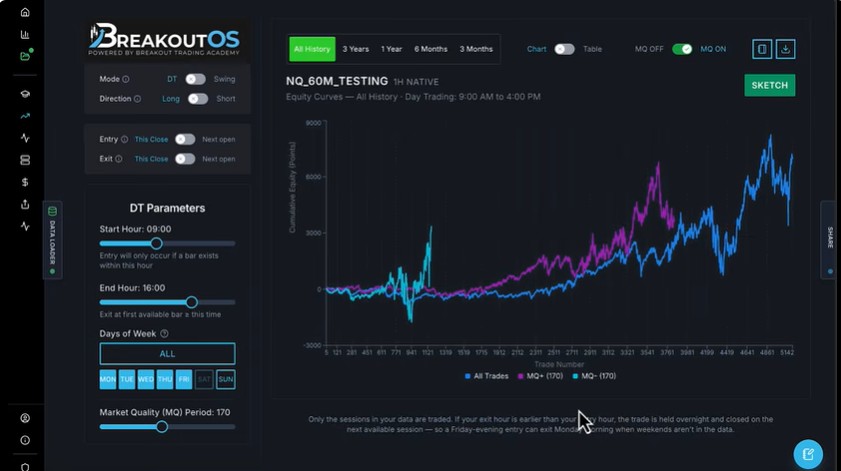
For this test I used the Map Your Market's Strong Days and Hours module inside BreakoutOS. With one click it takes a market and maps the entire edge across every realistic entry and exit hour combination.
I loaded the E-mini NASDAQ on a 60-minute timeframe, which is about 20 years of history. Then I pressed a single button, Sketch, and in five to ten seconds the module built the entire map. What happens if you enter at midnight and exit at 1am? What happens if you enter at 9am and exit at 10am, 11am, noon, and so on? Every realistic pairing gets tested.
That produces 276 combinations. People round it up to 300, but the exact number for day trading is 276. Because these are day trading strategies, the test exits before midnight, since most platforms recognise midnight as a new day, so the final bar of the session is 11pm.
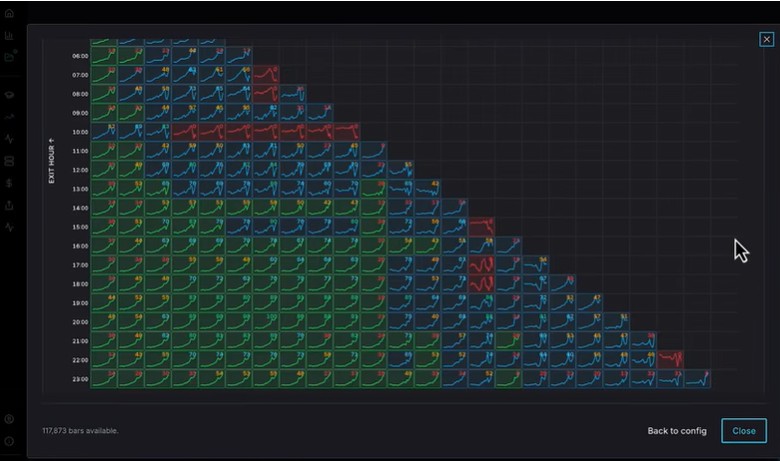
The result is a complete heatmap of the market's time-based edge. Every cell is a tested strategy, and you can colour the whole map by whatever metric matters to you, such as win percentage, net profit, or net profit to drawdown ratio. The map shows you instantly where the interesting areas are so you can focus there instead of guessing.
What the Robustness Score Actually Measures
Every cell on the map carries a small number: a robustness score. This is the single most important guardrail against fooling yourself, so it is worth understanding exactly what it measures.
The robustness score looks at the cells surrounding the one you selected. If you take a time window, say 8am entry to 8pm exit, the score reflects how well the neighbouring windows perform. The more surrounding cells that keep performing well, the higher the score, all the way up to a maximum of 100.
Here is why that matters. If shifting your entry or exit by a single hour either way destroys the edge, that edge is fragile and almost certainly the product of curve-fitting. If you can shift the window by an hour and nothing bad happens, the edge is structural and far more likely to survive in live trading.
One important warning from this test: a high robustness score is necessary but not sufficient. An 8am to 8pm Monday window scored a perfect 100, yet its equity curve was ugly and not tradable. Robustness tells you an edge is stable, not that it is profitable. You still have to look at the equity curve, the drawdown, and the recent performance before you trust it.
Filtering the Map Down to Real Edge
With 276 combinations on the screen, the next job is to narrow down to the windows worth trading. There are two ways to work through the map.
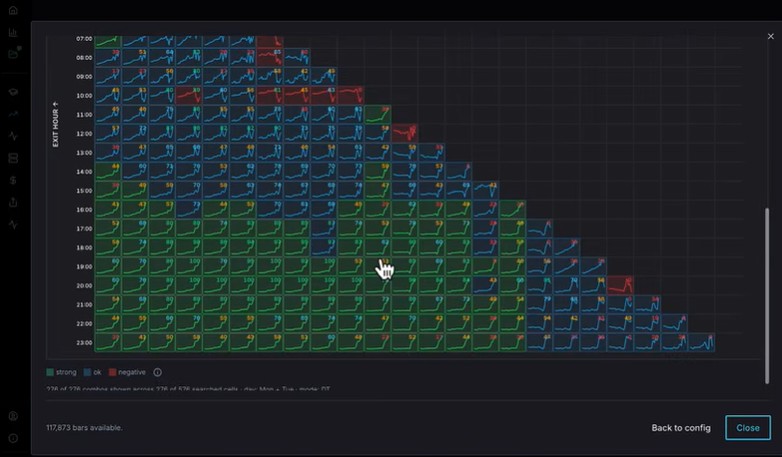
The first is to colour the whole map by a preference and eyeball the strong areas. If you like high win percentage, colour by win percentage and the strong cells light up. I prefer net profit to drawdown ratio, so that is my orientation, and the best areas jump straight out.
The better way is the advanced filter. You set hard requirements and the map eliminates everything that fails them. Want low drawdown? Start removing every high-drawdown solution until only the low-drawdown windows remain. Want a high win rate? Roll the filter up until only the high win percentage windows are left. Now the map is pointing only at solutions that meet your standards.
This is the discipline that keeps you out of trouble. Instead of cherry-picking the single best-looking cell, which is the fastest route to an overfit strategy, you define what a tradable strategy needs to look like, low drawdown, decent win rate, high robustness, and let the data surface only the windows that qualify.
See BreakoutOS in Action
Watch a live demo and see how traders map markets and build breakout strategies in minutes.
Watch the DemoWhat the Data Showed: Monday and Tuesday Own the Long Side
After filtering, one finding kept repeating: Mondays and Tuesdays are the strong long-side days on the E-mini NASDAQ. This was not a one-year fluke. Across nearly 20 years of data, with the bias especially clear over the last six to eight years, the early week carried a consistent upward tendency.
The outlier window was a 10am entry and a 10pm exit on Monday and Tuesday. Sorted by highest average trade, the edge concentrated towards the back half of the day, and when I combined Monday and Tuesday into a single window the equity curve held up well, with only a couple of recent trades dragging it, the kind of damage a stop loss would have contained.
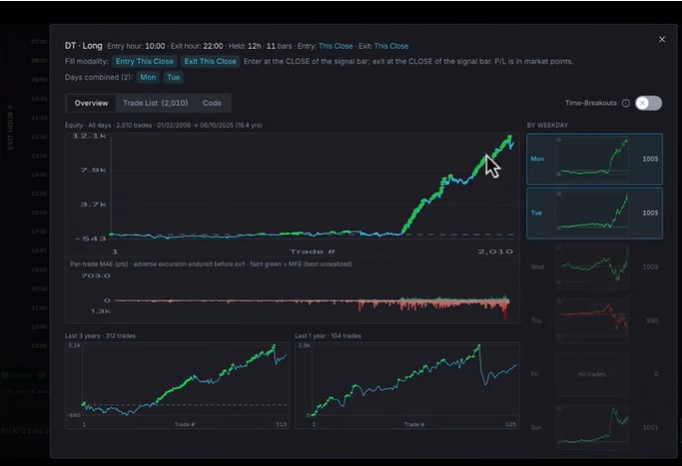
That last point matters. These results were generated with no stop loss at all. That means the occasional large losing trade you see in the equity curve would have been much smaller in practice. The raw, unprotected version already looked tradable, which is a good sign for what a properly risk-managed version could do.
There were faster edges too, such as entering at midnight and holding the first few hours of Tuesday, which showed some nice pockets of opportunity. But the standout, the 1% outlier from 276 combinations, was the Monday and Tuesday 10am to 10pm long window.
Why Thursday Flips the Script (the Short-Side Edge)
The map does not only reveal where to go long. It also reveals where the market leans the other way. When I isolated the back half of the week, the picture inverted. The Wednesday-into-Thursday region of the map was almost entirely red.
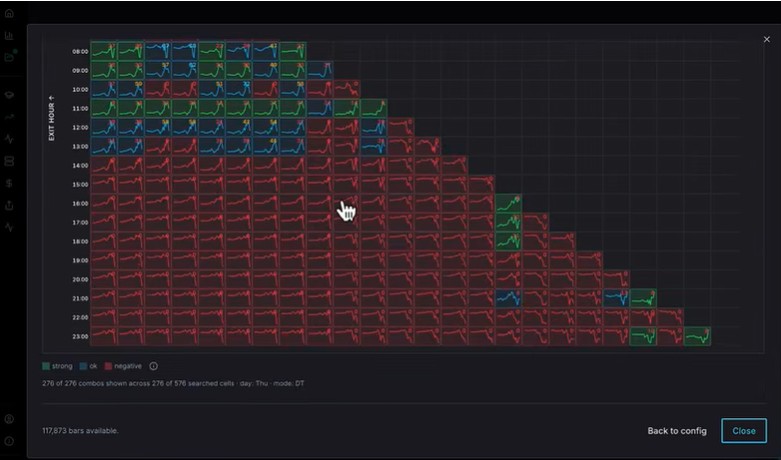
In plain terms, if you want to build short strategies on the E-mini NASDAQ, Thursday is the day to look at. The module lets you swap into short trading tests directly, and the late week shows clear potential for short-biased breakout strategies in a way the early week does not.
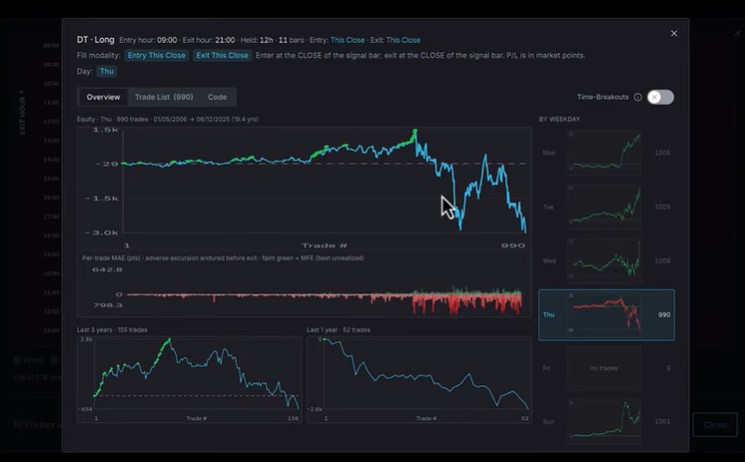
This is the real power of mapping. In a few minutes you learn that NASDAQ wants to go up early in the week and is far more willing to fall later in the week. That single insight shapes every strategy you build on the market afterwards.
Three Ways to Use a Time Strategy
Once you have found a strong time window, BreakoutOS lets you put it to work in three ways. You can also export the rules to EasyLanguage, NinjaScript, MetaTrader, PineScript for TradingView, AmiBroker, Python, or plain pseudocode, so the logic runs on whatever platform you trade.
- As a standalone strategy. Generate the window as a complete strategy with a fixed entry and exit time and trade it on its own. The Monday and Tuesday long window is a viable example.
- As a filter. Generate the window as a condition, for example "if it is Monday and the time is after 10am and before 10pm." You then only allow your other strategies to trade inside that favourable window, which removes trades taken at the wrong time.
- As a canvas. Save the window to the built-in notebook and carry it into another module, such as the Foundational Breakout Strategies Builder. Now you build your breakout entries only inside that proven window. This is where the real power lives, because you are stacking a real edge on top of an already favourable backdrop.
That third option is the one I would push you towards. A strong time window is rarely the finished strategy. It is the foundation. Build on top of it and you start compounding edges instead of relying on any single one. If you want to see how those breakout entries get built, start with our step-by-step strategy build.
Frequently Asked Questions
What is a time-of-day trading strategy?
Is there a best time of day to trade the Nasdaq (NQ)?
Do day-of-week trading patterns actually work?
How do you avoid overfitting when testing hundreds of strategies?
Can you trade a time strategy on TradingView, NinjaTrader or MetaTrader?

About the Author
Tomas Nesnidal, known to the systematic trading community as Mr. Breakouts, is a breakout trading specialist, hedge fund co-founder, and creator of BreakoutOS. He has managed institutional portfolios using breakout strategies for over 15 years, trading from 65+ countries. He is the author of The Breakout Trading Revolution and co-founder of Breakout Trading Academy.