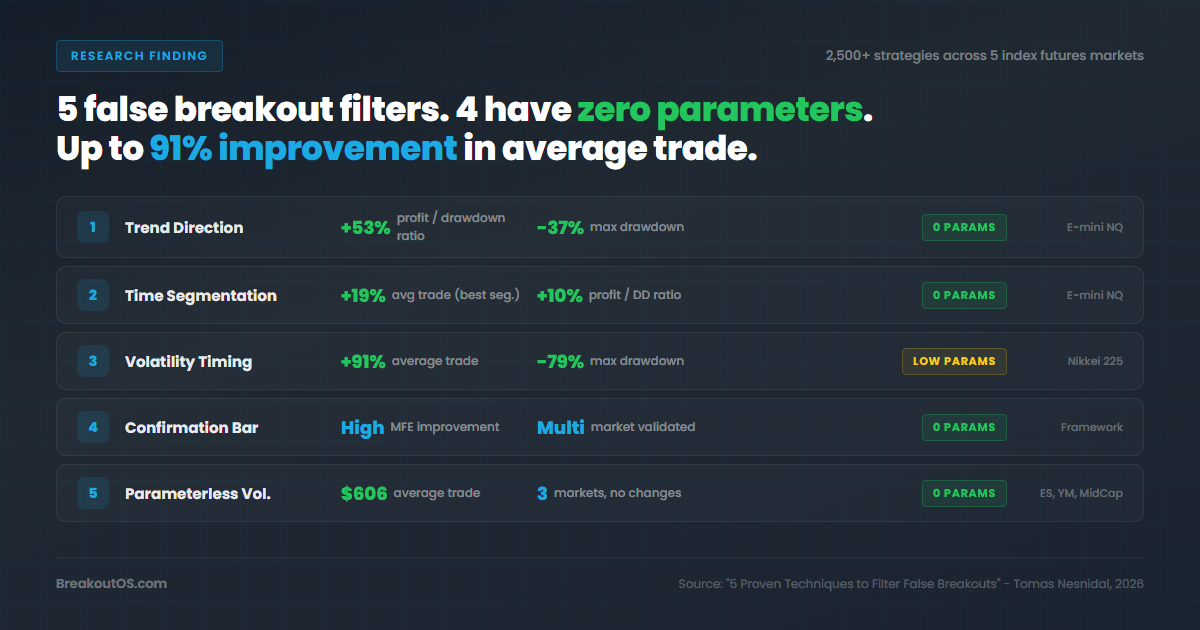
False breakouts are the single largest source of performance drag in breakout trading strategies. After modeling over 2,500 strategies across multiple index futures markets - including E-mini NASDAQ, E-mini S&P 500, E-mini Dow Jones, S&P 400 MidCap, and Nikkei 225 - we identified five distinct filtering techniques that consistently reduce false entries while carrying minimal overfitting risk.
The most effective technique (volatility timing via ATR bins) improved average trade size by 91% on the Nikkei 225 while reducing drawdown by 79%. The simplest technique (trend direction filter) improved the profit-to-drawdown ratio by 53% on E-mini NASDAQ using zero optimizable parameters.
All five techniques share a common principle: they filter trades based on structural market conditions rather than indicator optimization. This makes them robust across markets and time periods. When stacked together, they progressively eliminate low-quality entries without introducing curve-fitting risk.
Why Most Traders Fail at Filtering
The typical approach to reducing false breakouts goes like this: a trader sees losing trades in the backtest, adds an indicator with a threshold, optimizes the threshold until the backtest looks better, and declares the problem solved.
This is exactly backwards.
Every parameter you add to a strategy is a degree of freedom. Every degree of freedom is an opportunity to overfit. The more precise your filter looks in the backtest, the more likely it is capturing noise specific to that historical dataset rather than a genuine market behavior.
A trader who adds RSI with a threshold of 63.5 is not filtering false breakouts. They are fitting their strategy to a statistical artifact. When that strategy goes live, the filter breaks down because it was never capturing a real edge in the first place.
The approach documented in this research is fundamentally different. Instead of adding indicator-based filters with tunable parameters, we use structural conditions derived from trading logic - conditions based on how markets actually behave rather than on mathematical optimization. These conditions either have zero parameters to optimize or use broad categorical bins that resist overfitting.
The distinction matters: a filter based on "is the market trending up today?" captures genuine directional momentum. A filter based on "is the 14-period RSI above 63.5?" captures a data artifact.
Research Basis and Methodology
The techniques presented in this research were developed and tested within a hedge fund environment running approximately 2,500 breakout strategies simultaneously. All strategies are built on the same foundational breakout model (the Mr. Breakouts formula from the Breakout Trading Revolution framework), which uses a point of initiation combined with an ATR-based breakout level.
Test conditions across all techniques:
- Base strategy: Mr. Breakouts formula - moving average (period 10) on daily data as point of initiation, breakout level calculated as point of initiation + 2.2 x ATR(20), stop-loss $3,000, exit at end of day
- Primary test market: E-mini NASDAQ, 60-minute bars, 2021-2026 data
- Additional markets tested: E-mini S&P 500, E-mini Dow Jones, S&P 400 MidCap, Nikkei 225
- Validation method: In-sample (80%) / out-of-sample (20%) split, with cross-market validation for parameterless filters
- Base strategy intentionally unfiltered to isolate the effect of each technique
The base model is deliberately imperfect - it has drawdowns and a choppy equity curve. This is by design. Starting with a raw, unfiltered model makes the impact of each technique clearly visible and measurable.
Technique 1: Trend Direction Filter
Logic: Before entering a long trade, check if the high of the entry bar is above today's open. For short trades, check if the low of the entry bar is below today's open. If the condition is not met, skip the trade.
Parameters to optimize: Zero.
This is the simplest and most universally applicable false breakout filter we have tested. The concept is straightforward: before committing capital to a breakout trade, confirm that the market is already moving in your intended direction for the session.
The session start can be defined as either today's open or yesterday's close - both produce similar results. What matters is that the entry bar sits on the correct side of that reference level. If you are taking a long breakout but the market has been trading below its opening price all day, you are entering into noise, not momentum.
Results on E-mini NASDAQ
| Metric | Before (No Filter) | After (Trend Filter) | Change |
|---|---|---|---|
| Profit/drawdown ratio | 5.24 | ~8.0 | +53% |
| Maximum drawdown | ~$40,000 | ~$25,000 | -37% |
| Average trade | $120 | $162 | +35% |
| Equity curve | Choppy | Smooth, steadily rising | - |
The transformation is significant. Drawdown drops by 37%, the profit-to-drawdown ratio improves by over 50%, and the average trade increases from $120 to $162. The equity curve shifts from choppy and volatile to smooth and steadily rising.
Why This Works Without Overfitting
There is no lookback period to tune. No threshold to tweak. No moving average length to fit to historical data. The filter is a binary condition based on pure market structure: is the entry bar's high above today's open, yes or no.
Every trend trader and breakout trader naturally prefers entering into an established move. This filter simply codifies that intuition into a testable rule. Because there are no parameters, there is nothing to accidentally curve-fit. This makes it one of the most reliable filters you can apply to any breakout strategy.
Technique 2: Time Segmentation (T-Segment)
Logic: Split the trading day into time segments (pre-market, regular session, after-market) and measure strategy performance in each segment independently. Remove the segment where the strategy performs worst.
Parameters to optimize: Zero (segments are defined by market structure, not optimization).
Every market in the world operates on a natural time structure. Futures markets based in Chicago have regular trading hours (roughly 8:00 AM to 3:00-5:00 PM), a pre-market session (overnight through early morning), and an after-market session. Each segment has fundamentally different characteristics because the participants, volume, and volatility profiles change dramatically depending on the time of day.
The T-Segment technique exploits this by splitting your strategy's trades into these natural time buckets and comparing performance. On most markets, you will find at least one time segment where your strategy consistently underperforms or actively loses money. Removing that segment is one of the lowest-risk improvements you can make.
Results on E-mini NASDAQ
When the base strategy (average trade: $120, profit/drawdown: 5.24) was segmented into three time periods, the results were immediate and clear:
- Pre-market session: Consistently losing money. The strategy generates noise trades in low-participation hours.
- Regular session: Produces profits but with significant variability.
- After-market session: The strategy thrives, with the strongest and most consistent performance.
Removing just the pre-market segment:
| Metric | Before | After (No Pre-Market) | Change |
|---|---|---|---|
| Average trade | $120 | $130 | +8% |
| Profit/drawdown ratio | 5.24 | 5.79 | +10% |
Focusing on after-market only:
| Metric | Before | After (After-Market Only) | Change |
|---|---|---|---|
| Average trade | $120 | $143 | +19% |
| Drawdown | Significant | Reduced (removed large drawdown periods) | - |
The improvement from removing the pre-market segment alone is modest - about 8-10% across key metrics. But the critical point is that this carries zero overfitting risk. You are not optimizing a parameter. You are removing trades that occur during hours when the market's natural behavior does not support your strategy's logic.
When stacked with other techniques, even modest improvements compound into substantial performance gains.
Technique 3: Volatility Timing (ATR Bins)
Logic: Measure the recent ATR (average true range), create a range from the highest to lowest ATR values over a lookback period, split that range into bins (typically two), and determine whether the current ATR falls in the high-volatility or low-volatility bin. Trade only in the favorable volatility zone.
Parameters to optimize: Minimal (ATR period and bin lookback - broad categorical choices, not precise optimization).
This technique produced the largest single improvement of any method in our testing. The concept is rooted in a fundamental property of breakout trading: breakout strategies behave very differently depending on the current volatility environment. Some strategies perform dramatically better in low-volatility environments (where a volatility expansion is imminent), while others prefer established high-volatility conditions.
The binning approach works by taking the ATR over a recent period (short-term: roughly one week; mid-term: roughly one month; long-term: roughly 100 days), finding the highest and lowest values in that range, and splitting the resulting band into two or three equal bins. Each trade is then categorized by which bin the current ATR falls into at the time of entry.
Results on Nikkei 225
The base strategy on Nikkei 225 was already a viable model built in the previous research phase. When volatility timing was applied using short-term ATR bins (two bins, low vs. high), the results were extraordinary:
| Metric | Before | After (Low Volatility Bin) | Change |
|---|---|---|---|
| Average trade | $160 | $306 | +91% |
| Maximum drawdown | ~$7,000 | ~$1,500 | -79% |
| Profit/drawdown ratio | 5 | 20 | +300% |
| Net profit | $33,000 | $31,000 | -6% (fewer trades, similar total) |
An average trade increase from $160 to $306 is a 91% improvement. That alone provides a massive cushion against slippage and commission drag. But the drawdown reduction - from $7,000 to $1,500 - is what makes this technique transformative. The profit-to-drawdown ratio jumps from 5 to 20, a level that represents an exceptionally robust strategy.
In-Sample vs. Out-of-Sample Validation
The critical validation step: the strategy was developed on 80% of the data (in-sample) and then tested on the remaining 20% (out-of-sample). The out-of-sample performance matched the in-sample results at 100% consistency. The low-volatility preference held perfectly on unseen data.
This confirmation across two, three, and four bins further validates the finding. Regardless of how granularly you split the volatility range, the strategy consistently performs better in low-volatility entries. That kind of consistency across multiple bin configurations is strong evidence of a genuine market behavior rather than a statistical artifact.
Why Low Volatility Works for Breakouts
The finding that breakout entries during low-volatility periods outperform high-volatility entries has a straightforward explanation: low volatility often precedes volatility expansion. When ATR is compressed, the market is coiling. A breakout during a coiled period is more likely to produce genuine follow-through because the stored energy releases in one direction. Breakouts during already-high-volatility periods compete with erratic price action and are more prone to whipsaws.
Download This Article as a PDF
Get the complete article in a clean, printable format.
Free download. We'll send the PDF to your inbox. You'll also receive future updates. Unsubscribe anytime.
Check your email
Your PDF is on its way. Check your inbox (and spam folder, just in case).
Technique 4: Confirmation Bar
Logic: Before entering a long breakout, check whether the bar immediately before the entry bar was an "up bar" (closed higher than it opened, or made a higher high and higher low compared to the preceding bar). If it was a down bar, skip the trade. For short entries, the reverse applies.
Parameters to optimize: Zero.
The confirmation bar is one of the most underused filters in breakout trading, yet it addresses a fundamental problem: breakouts that occur against the immediate price direction are far more likely to be false.
Consider the mechanics. Your breakout level is hit and a long entry triggers. But the bar immediately before that trigger was a down bar - price was actually falling heading into the breakout. That contradiction is a warning sign. The breakout is happening, but the most recent price action was moving against it. These entries have materially lower maximum favorable excursion (MFE), meaning the trade rarely moves meaningfully in your favor before stopping out or expiring.
The confirmation bar filter eliminates these contradictory entries. It ensures there is immediate momentum supporting the breakout direction before you commit capital.
Why This Filter Is Highly Robust
The confirmation bar uses no indicators at all. It relies entirely on raw price action - the open, high, low, and close of a single bar. There is nothing to optimize, nothing to curve-fit, and nothing that degrades across different markets or timeframes.
When combined with the trend direction filter (Technique 1), the confirmation bar creates a two-layer validation: the broader session direction must support your trade, and the immediate bar-level momentum must confirm it. This combination catches both macro-level noise (no session trend) and micro-level noise (immediate price action contradicts the breakout).
Technique 5: Parameterless Volatility Filter
Logic: For long entries: High of 2 bars ago minus True Range must be greater than today's Open. For short entries: Low of the current bar plus True Range must be less than today's Open.
Parameters to optimize: Zero.
This filter represents the purest form of a structural market condition. Every value in the calculation - High, Low, Open, True Range - comes directly from the price bars themselves. There is no lookback period to set, no multiplier to choose, no threshold to define.
The True Range is a fixed formula: the greatest of (current high minus current low), (absolute value of current high minus previous close), or (absolute value of current low minus previous close). It requires no user-defined inputs.
What the filter does in practice: it only permits entries when the market has already demonstrated sufficient directional movement relative to today's opening price. Long entries fire only when price has moved up enough that the high of 2 bars ago, adjusted by True Range, exceeds the daily open. This self-adjusts to volatility conditions automatically - in high-volatility environments, the True Range is larger, so the market needs to move further to satisfy the condition.
Results on E-mini S&P 500
| Metric | Value |
|---|---|
| Average trade | $606 |
| Timeframe | 30-minute bars |
| Direction | Long and Short |
| Entry window | 8:00 AM - 3:00 PM |
| Max trades per day | 2 |
A $606 average trade on the E-mini S&P 500 is exceptionally high. This provides substantial margin against slippage, commissions, and the inevitable backtest-to-live degradation that occurs with any strategy.
Cross-Market Validation
Because this filter has zero parameters, it can be applied to other markets with no re-optimization. We tested it on two additional markets:
- E-mini Dow Jones (YM): Worked without modification
- E-mini S&P 400 MidCap: Worked without modification
When a filter performs across multiple correlated but distinct markets without any adjustment, it is strong evidence that the filter captures a genuine market behavior rather than a statistical artifact of one dataset. This is the hallmark of a truly robust filter.
In the hedge fund, we maintain a database of parameterless filters. Many of our approximately 2,500 strategies use filters from this database. The filter described here is among the simplest, but simplicity is a feature. Simple filters are easier to understand, easier to trust, and far less likely to break in live trading.
Comparison of All Five Techniques
| Technique | Effectiveness | Overfitting Risk | Ease of Implementation | Markets Tested |
|---|---|---|---|---|
| Trend Direction Filter | High (+53% profit/DD ratio) | Zero | Very easy - one line of code | E-mini NASDAQ |
| Time Segmentation | Moderate (+8-19% avg trade) | Zero | Easy - time-based condition | E-mini NASDAQ |
| Volatility Timing (ATR Bins) | Very high (+91% avg trade, -79% DD) | Low (broad bins only) | Moderate - requires ATR binning logic | Nikkei 225 |
| Confirmation Bar | Moderate-High | Zero | Very easy - check prior bar | Multiple (framework-level) |
| Parameterless Volatility Filter | Very high ($606 avg trade) | Zero | Moderate - specific formula | E-mini S&P 500, Dow, S&P 400 MidCap |
Ranking by overfitting safety: Techniques 1, 2, 4, and 5 carry zero overfitting risk because they have no optimizable parameters. Technique 3 carries low risk because the ATR period and bin lookback are broad categorical choices (short-term vs. long-term), not precise numerical optimizations.
Ranking by magnitude of improvement: Techniques 3 and 5 produced the largest absolute improvements. Technique 1 produced the best improvement relative to its simplicity.
Ranking by cross-market portability: Technique 5 was explicitly validated across three markets without modification. Techniques 1, 2, and 4 use universal market properties (session direction, time structure, bar-level momentum) that apply to any market.
The Stacking Principle
These five techniques are not mutually exclusive. They operate on different dimensions of market behavior and can be layered for progressively better filtering.
The four levels of timing in breakout trading form a natural hierarchy:
- General timing - broad time-of-day and session conditions (Technique 2)
- System timing - is the market context right for our strategy? (Techniques 1 and 4)
- Volatility timing - is the current volatility environment favorable? (Technique 3)
- Market timing - specific structural conditions (Technique 5)
Each level acts as a filter gate. A trade must pass through all active levels before entry. By itself, each level is simple. Stacked together, they create a systematic framework for identifying and avoiding low-probability entries.
The critical rule when stacking: test each filter independently first. Validate that it improves out-of-sample performance on its own before combining it with other filters. Every filter you add reduces your trade count, so you need to confirm the trades being removed are genuinely low-quality, not just random losers that happened to share a characteristic.
When stacking is done correctly - simple filters, each validated independently, layered in sequence - the result is a strategy that trades less frequently but with dramatically higher quality per trade.
Key Findings
- False breakouts are best addressed through structural filters, not indicator optimization. Filters based on trading logic (session direction, time structure, volatility context, bar-level momentum) consistently outperform filters based on tuned indicator thresholds.
- Parameterless filters carry zero overfitting risk and can be applied across markets without re-optimization. The parameterless volatility filter (Technique 5) worked on E-mini S&P 500, E-mini Dow Jones, and S&P 400 MidCap without any modification.
- The trend direction filter (entry bar high vs. today's open) improved profit-to-drawdown ratio by 53% on E-mini NASDAQ with zero parameters. This is the single most efficient filter in terms of improvement per complexity added.
- Volatility timing via ATR bins produced the largest improvement: 91% increase in average trade and 79% reduction in drawdown on Nikkei 225. In-sample findings matched out-of-sample at 100% consistency.
- Breakout strategies in low-volatility environments consistently outperform those in high-volatility environments. Low volatility precedes volatility expansion, which produces genuine breakout follow-through.
- Time segmentation reveals that pre-market entries on E-mini NASDAQ consistently destroy value. Simply removing pre-market trades improved average trade by 8% with zero overfitting risk.
- The confirmation bar filter eliminates entries where immediate price action contradicts the breakout direction. These contradictory entries have materially lower maximum favorable excursion.
- Stacking multiple structural filters compounds improvements while maintaining robustness. The four levels of timing (general, system, volatility, market) provide a systematic framework for layered filtering.
- A $606 average trade was achieved on E-mini S&P 500 using a single parameterless filter - demonstrating that simplicity and high performance are not mutually exclusive.
- Across 2,500+ strategies in a hedge fund environment, parameterless and low-parameter structural filters are among the most valuable tools in the toolbox. They require no maintenance, no periodic re-optimization, and no market-specific adjustments.
See BreakoutOS in Action
Watch a full strategy build from blank slate to validated model.
Watch Demo Videos →Frequently Asked Questions
These five filtering techniques are the foundation of the methodology inside SFB PRO - the false breakout module in BreakoutOS that lets you analyse and apply these filters across your strategies visually, without coding.

About the Author
Tomas Nesnidal, known to the systematic trading community as Mr. Breakouts, is a breakout trading specialist, hedge fund co-founder, and creator of BreakoutOS. He has managed institutional portfolios using breakout strategies for over 15 years, trading from 65+ countries. He is the author of The Breakout Trading Revolution and co-founder of Breakout Trading Academy.
Download This Article as a PDF
Get the complete article in a clean, printable format.
Free download. We'll send the PDF to your inbox. You'll also receive future updates. Unsubscribe anytime.
Check your email
Your PDF is on its way. Check your inbox (and spam folder, just in case).