BreakoutOS includes a built-in robustness testing suite that runs five automated validation tests on any breakout strategy prototype. Each test produces a specific score or pass/fail result, and together they tell you whether a model is likely to survive live trading or whether it is just curve-fitted noise.
Why Most Backtested Strategies Fail Live
The reason is almost always the same: overfitting. A trader finds a parameter combination that looks great on historical data, skips the validation, goes live, and watches the strategy fall apart within weeks.
The fix is not more sophisticated backtesting. It is more rigorous robustness testing. In our hedge fund, we run one of the most rigid robustness test procedures you can imagine. That is how we maintain confidence in forward performance.
BreakoutOS packages this same institutional-grade process into five automated tests that anyone can run.
The 5 Robustness Tests Inside BreakoutOS
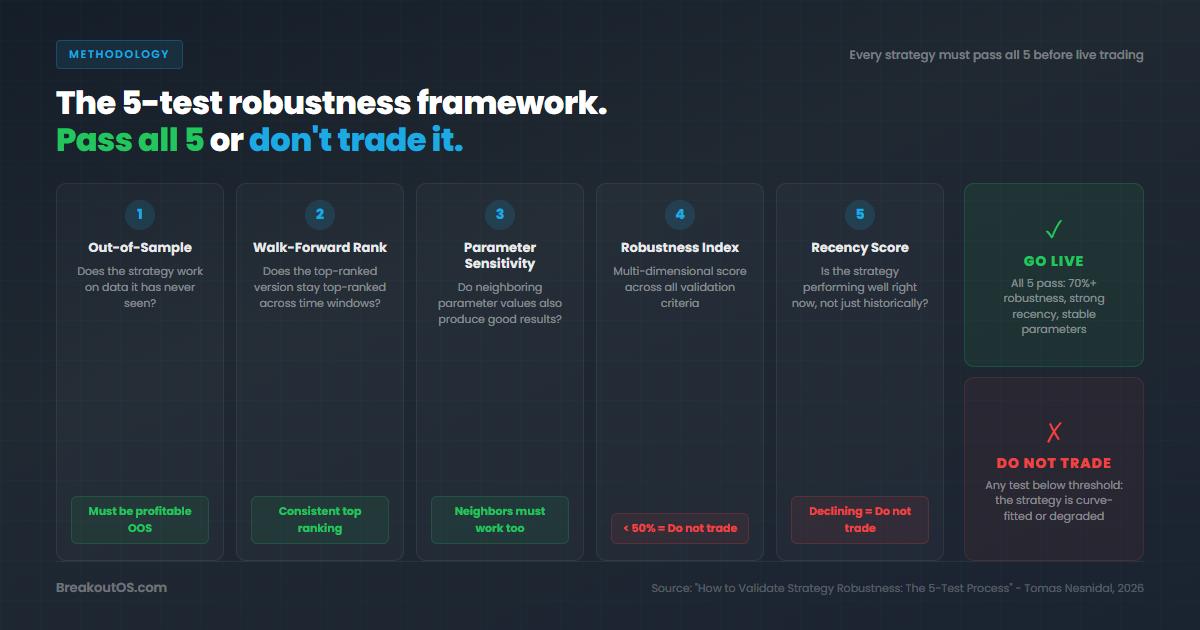
Test 1: Out-of-Sample Performance
This is the most important single test. During the prototyping phase, BreakoutOS automatically splits your data into in-sample (the first portion, typically years 1-6) and out-of-sample (the last three years, held back unseen).
When you trigger the out-of-sample test, the platform reveals the held-back data and checks whether the equity curve continues its positive trajectory on data the model has never seen.
What a pass looks like: The equity curve continues smoothly into the out-of-sample period with similar slope and behavior. In our E-mini NASDAQ test, the results were strong - the model delivered consistent performance on three years of completely unseen data.
What a fail looks like: The equity curve collapses, flattens, or reverses as soon as it hits out-of-sample data. This means the model was trained on noise, not signal.
Test 2: Parameter Sensitivity (Neighbor Values)
This is the test most traders skip - and the one that catches the most curve-fitted junk. If your best space multiplier is 1.0, BreakoutOS checks whether the neighbor values (0.8 and 1.2) also produce good results.
What a pass looks like: The three values (0.8, 1.0, 1.2) all produce very similar, positive equity curves. In our test, the top three ranked spaces were 1.0, 0.8, and 1.2 - they clustered together perfectly. That is as good as parameter stability gets.
What a fail looks like: Changing the multiplier from 1.0 to 0.8 destroys the performance. You have found a fragile, isolated optimum rather than a robust structural edge.
Test 3: Walk-Forward Rank Stability
This test verifies a critical assumption: that the solution you picked will continue to rank well in the future.
BreakoutOS uses anchored walk-forward analysis. It takes increasing windows of data (years 1-2, years 1-3, years 1-4, and so on) and re-ranks all solutions for each window. Then it checks where your chosen solution ranks across every period.
What a pass looks like: Consistently low ranks throughout, with improving momentum into recent years. In our NASDAQ test:
- 2016-2017: ranked #9
- 2017-2018: ranked #7
- 2018-2019: ranked #5
- 2019-2020: ranked #6
- 2020-2021: ranked #6
- Last four years: ranked #1, #1, #1, #1
- Overall average rank: 5.2 (best among all solutions)
That is exactly the pattern you want - consistent ranking with strong recent momentum.
What a fail looks like: The solution bounces between rank #1 and rank #25 across different windows. No consistency means no predictability.
Test 4: Proprietary Robustness Index (0-100%)
BreakoutOS includes a proprietary scoring system that analyzes all available data across multiple dimensions. It assesses an enormous number of combinations from many different angles and outputs a single score from 0 to 100%.
Score interpretation:
- 70-80%: Good robustness
- 80%+: Excellent robustness
- Below 50%: The model does not hold up under multi-dimensional stress
Our E-mini NASDAQ foundational model scored 72% - solidly in the good range.
Test 5: Recency Performance Index (0-100%)
This test measures whether the model shows positive momentum in recent data. The principle behind it: in futures markets, the last three years matter most. A model that performed well historically but has deteriorated recently is unlikely to recover. Markets evolve.
Our model scored 97% - about as high as you can get. Strong recent performance is the biggest indicator that a strategy will continue performing in the near future.
How to Read the Combined Results
Here is what a full validation pass looks like from our E-mini NASDAQ test:
| Test | Result | Status |
|---|---|---|
| Out-of-sample (last 3 years) | Equity curve continues on unseen data | Pass |
| Neighbor values (0.8, 1.0, 1.2) | All produce similar positive results | Pass |
| Walk-forward rank stability | Average rank 5.2, #1 for last 4 years | Pass |
| Proprietary robustness index | 72% | Pass |
| Recency performance index | 97% | Pass |
Every test confirmed the model is viable. Does that guarantee future profits? No - there is no certainty in trading. But it means a significant number of probabilities are on your side.
Red Flags That Indicate Curve-Fitting
After running all five tests, watch for these warning signs:
- Great in-sample, poor out-of-sample. The classic overfitting signature.
- Isolated parameter optimum. If only the exact best parameter works and neighbors fail, the edge is not structural.
- Erratic walk-forward ranks. Inconsistency across time windows means the model's performance is period-dependent.
- Low robustness score. Below 50% means the model fails under multi-dimensional analysis.
- Declining recency. A model that worked five years ago but has weakened recently is a model you should not trade.
The Workflow: Prototyping to Validation in One Session
The entire process inside BreakoutOS is sequential and modular. You prototype (roughly 10 seconds for 468+ combinations), review the ranked results, then click through each robustness test one by one. Each test builds on the previous - you do not move forward until the current test passes.
If a model fails any test, you go back to the prototyping results and evaluate the next-ranked candidate. The process is fast enough that you can test multiple models in a single sitting.
Related Research
5 Proven Techniques to Filter False Breakouts (Data From 2,500+ Strategies) - Five zero-parameter filtering techniques tested across four index futures markets to reduce false breakouts and improve robustness.
See BreakoutOS in Action
Watch a full strategy build from blank slate to validated model.
Watch Demo Videos →Frequently Asked Questions

About the Author
Tomas Nesnidal, known to the systematic trading community as Mr. Breakouts, is a breakout trading specialist, hedge fund co-founder, and creator of BreakoutOS. He has managed institutional portfolios using breakout strategies for over 15 years, trading from 65+ countries. He is the author of The Breakout Trading Revolution and co-founder of Breakout Trading Academy.